
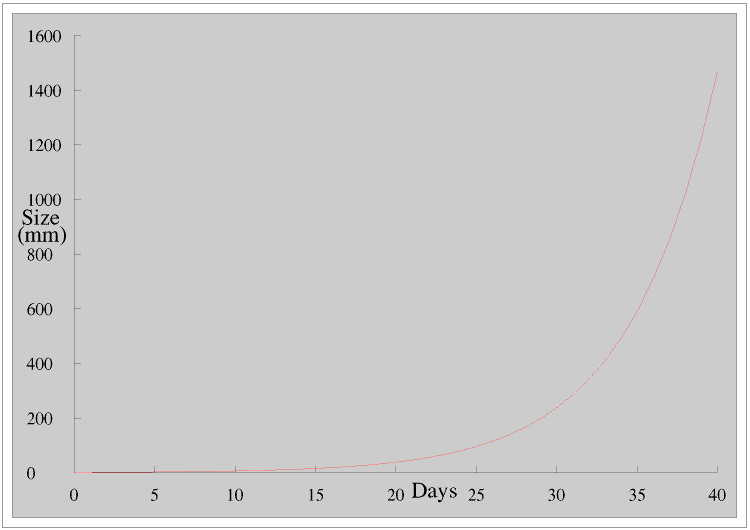
James is a little worried because this graph seems to show that the leaf is hardly growing at all for the first fifteen days, so he shows it to his teacher. His teacher explains that this is because the leaf is growing exponentially: it is doubling its diameter about every four days. (The proof of this, and also a discussion on it, is at the end of this Page, Proof 1.)
He explains exponential growth by means of a simple series.
It is called an exponential series because n is a part of the exponent. (Remember that 20 = 1)
He goes on to tell James the story about the Emperor of China and the man who invented the game of chess. The Emperor was so pleased with the game that he asked the inventor what he wanted. He replied “ Just one grain of rice for the first square of the chess board, two for the second, four for the third, eight for the fourth, and so on.” The Emperor was very pleased with the man’s modest request - until his mathematicians worked out that by the time they reached the 64th square there was not enough rice in the whole of China to pay him.
His teacher then explains to James that if we have an exponential equation of the form y = abx where a and b are constants the graph of y against x is a curve but the graph of log y against x is a straight line. (The proof of this, Proof 2, is at the end of this Page.) James goes away and replots his results in this way.
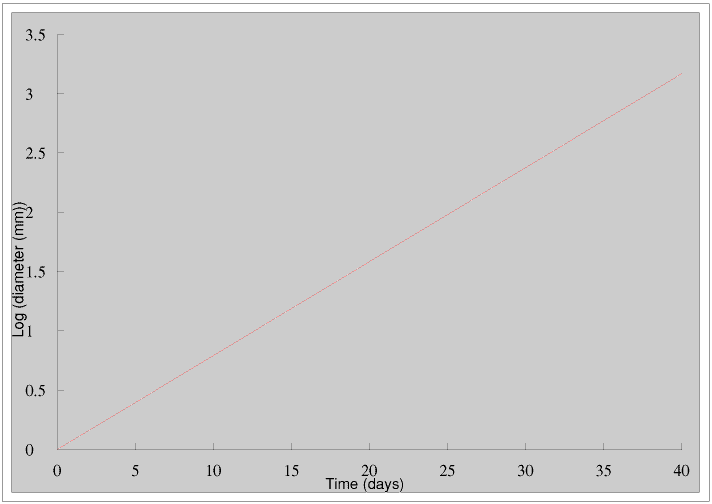
James gets a straight line, but he does not think this is any better because he still has to do conversions into and out of logs using log tables.
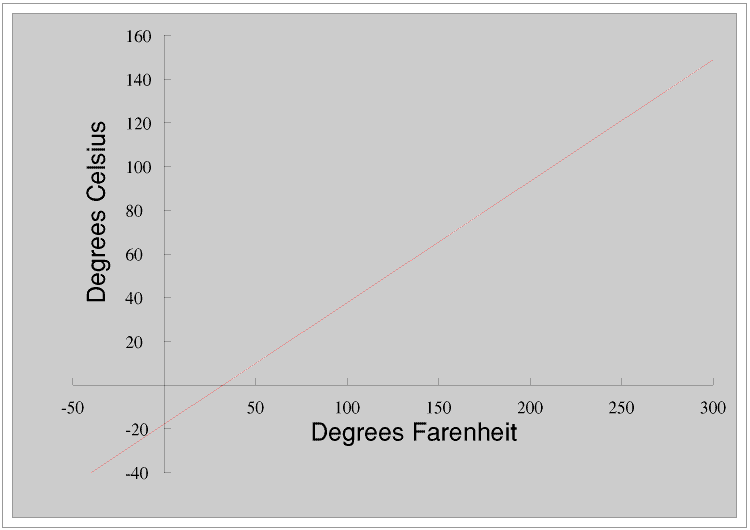
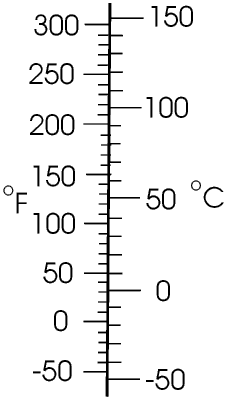
We often convert from one quantity to another using a graph. Here is the graph for converting between degrees Farenheit and Celsius.
James plots log x against x - as described earlier he only needs to do it for values of x from 1 to 10.
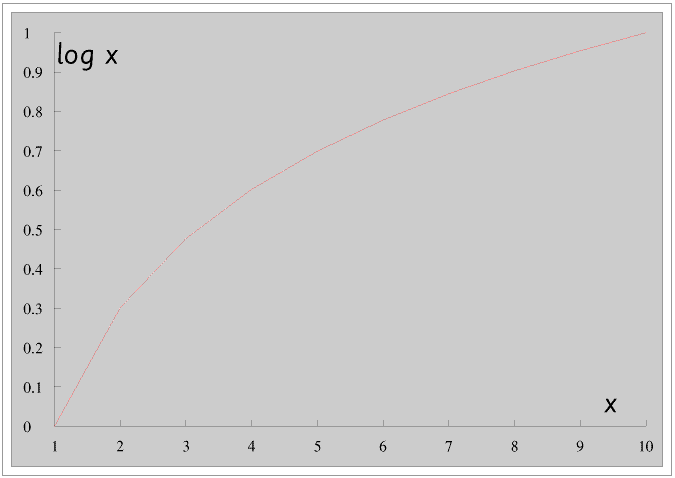
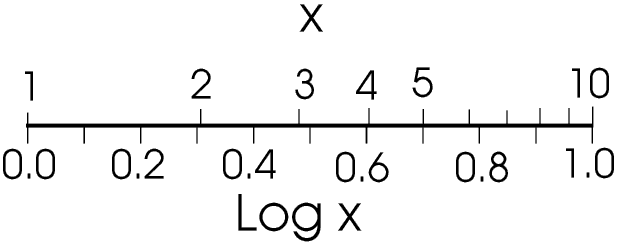
This is a curve, that is the relationship is non-liniar. We can see this if we put the two scales together.
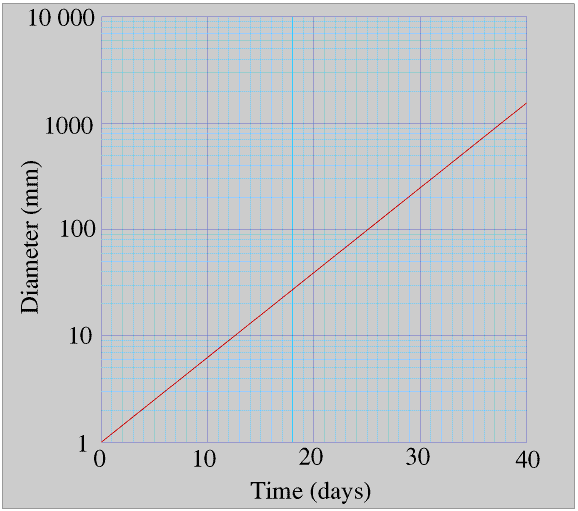
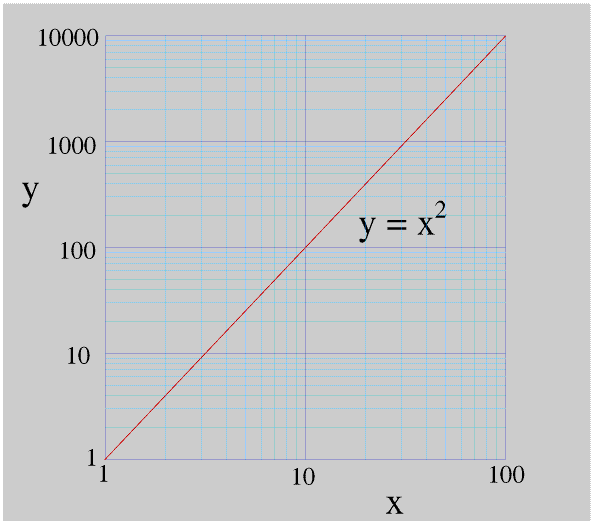
Here James used log/log graph paper with 2 cycles on the x axis and 4 cycles on the y axis. The last number in each cycle is always ten times the first, so the cycles for the diameter go from 1 to 10, 10 to 100, 100 to 1000, 1000 to 10000 etc. If James had used metres rather than millimetres the cycles would have been 0.001 to 0.01, 0.01 to 0.1, 0.1 to 1, and 1 to 10.
Graphs using log/liniar or log/log (or polar/log) axes are very useful in all sorts of ways. But there are so many different sorts of graph paper (for example liniar/3 cycle log or 2 cycle log/4 cycle log) that you can only buy it from specialist suppliers. If you need paper like this and have a computer you would probably find it more convenient and cheaper to buy or download a special program which prints the paper for you to your own requirements. Going one stage further, most spreadsheet, database and maths programs will draw the whole graph for you, including the axes and grid lines. (How do you think I produced the graphs on this Page?).
The problem with exponential growth is that it starts very slowly but then increases very rapidly, as the Emperor of China found out! Plotting results on log paper make it very easy to see whether something is growing exponentially or, just as important, whether it is not. Being able to work out whether something is growing exponentially from only a few results can be very important, because exponential growth starts very slowly and by the time you realise you have a problem it may often be too late to do anything about it.
Although the Lake is more than 100 m across James looks at his graph and realises that in less than a month his plant will cover its whole surface; he also realises that tomorrow it will be bigger than him, so he decides to end the experiment now, while his plant is still small enough for him to take it out of the Lake.
Logarithmic scales are enormously important in all sorts of ways, not only for plotting graphs. One use is in situations where a quantity can have a very wide range of values. For example, we use a logarithmic scale for measuring the loudness of a sound.
We hear sounds because pressure waves in the air vibrate our eardrums. In terms of their energy the pressure waves that cause the loudest sound that we can hear without feeling pain are a million million (1012) times more powerful than those which cause the quietest sound we can hear. We measure the loudness of a sound using a logarithmic scale in bels, after Alexander Graham Bell (1847 - 1922). Actually we almost invariably use decibels (dB) rather than bels - one bel is ten decibels. The quietest sound we can hear is 1 bel (10 dB). A sound of 2 bells (20 dB) is ten times louder, so a sound that is a million million (1012) times louder is 12 bels (120 dB), and 50 dB is ten times louder than 40 dB. We can show that a change of 1 dB represents about a 26% change in sound level, this is the smallest difference in sound level most people can detect.
Our ears are sensitive to an incredible range of energy levels: if our eyes were this sensitive we would be able to see a candle on the surface of Mars!
The Richter scale for measuring the strength of earthquakes is also a logarithmic scale, so a force 8 earthquake is ten times more powerful than one of force 7, and one of 6.7 is about 26% more powerful than one of 6.6
Until the advent of the scientific calculator many people, particularly architects, engineers and designers, used a slide rule. A slide rule has two sliding logarithmic scales, in effect it performed multiplications by adding logs but was very much quicker, and more portable, than using log tables. The slide rule was so much a part of the tools in trade of the engineer that the novelist Nevil Shute (whose real name was Neville Shute Norway and who had been an engineer before he became a full-time writer) called his autobiography “Slide Rule - The Autobiography of an Engineer.”
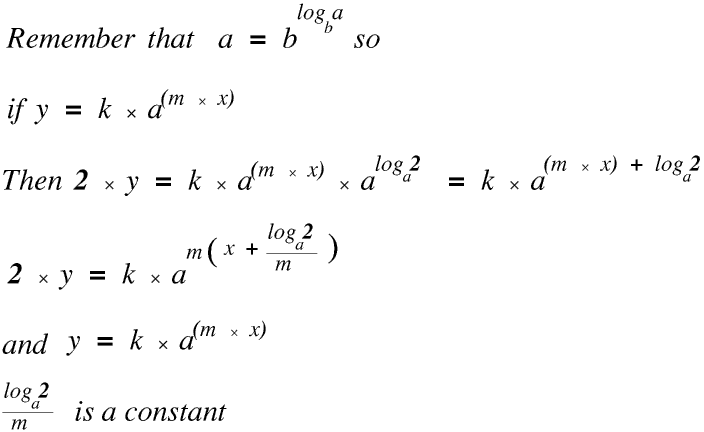
What this means is that if we multiply a value of y, any value, by 2 (or in fact any number) we add a constant to the value of x. So the time taken for James's plant to grow from 5 mm to 10 mm is the same as the time taken for it to grow from 23 mm to 46 mm.
