RMS voltage and current (for Advanced Readers)
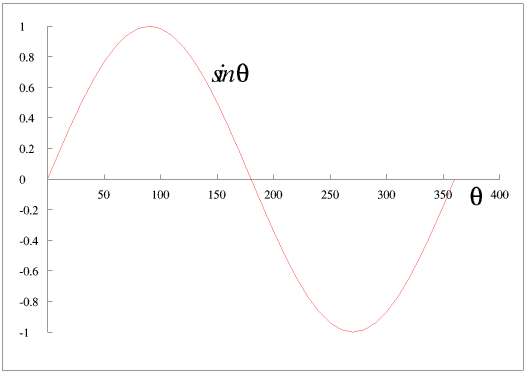
If we plot sine θ against θ we get a sine wave - this graph shows just one cycle but it repeats every 360°.

Sine waves occur a lot in Nature, and the voltage and current in an alternating current circuit are sine waves.From this picture we can easily see that the area of the graph above the θ axis is exactly the same as that under it, so that over one complete cycle the mean (“average”) θ, and therefore also the voltage and current, are all zero.
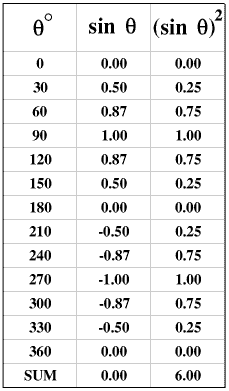
However, as described earlier on this Page, the heat produced by a resistor is I² × R, which is positive whether I is positive or negative, so the heat produced over one complete cycle is not zero.

The sum of the values in the third column is 6 and the number of values is 12 so the mean is a half. So we can calculate a DC current which would produce the same amount of heat over the time for one complete cycle by taking the square root of the mean of the square of the AC current over one cycle - this is the rms (root mean square) current. So

Similarly for rms voltage: when we say mains voltage is 230 V this is 230 V rms so the peak voltage for each cycle is about 325 V.

© Barry Gray August 2017
